Screenshots
Forecastica is the most advanced AI/ML powered mobile stock forecasting and technical analysis platform that also puts you in the fast paced world of virtual global stock trading.
Gain access to 7 years of historical stock price data and 30 day stock price forecasts with BUY, SELL and HOLD trading signals powered by AI/ML that are based on our proprietary machine learning and neural networks model. Our stock symbol database includes roughly 200,000 stock symbols spanning 90 of the most well known global stock exchanges in the world . Each forecast day also includes a BUY, HOLD and SELL trading signal that is based on our proprietary trading signal machine learning algorithm. Our AI/ML powered trading signals are based on mathematically predicted turning points (relative minimum or maximum value of stock quotes vs. time)
Our proprietary model is based on artificial intelligence, machine learning and neural networks. Simply put, our AI/ML powered stock forecasts and BUY, SOLD HOLD trading signals are driven by cutting edge AI/ML that enables our model to identify stock-purchasing trends. It then provides an objective recommendation on what action to take with any given stock given via BUY/HOLD/SELL trading signals.
INCREASE YOUR INVESTMENT PERFORMANCE with our powerful and proven AI/ML powered stock price forecasts and trading signals.
Traders are ranked based on their Sharp Ratio. The Sharpe Ratio is a well-known and well-reputed measure of risk-adjusted return on an investment or portfolio.
It was developed by the economist William Sharpe. The Sharpe Ratio evaluates the total performance of an aggregate traders investment portfolios.
If a trader only has one trade their Sharp Ratio will be zero because more than one trade is necessary to calculate the Sharp Ratio. Click on screenshots below to see screens in more details and functionality.
Understanding Our 30-Day AI/ML Powered Stock Forecast
Our forecasting system uses a specialized "Anchor & Offset" approach to provide a more accurate, reliable, and logical look at potential stock price movements. Our model analyzes the behavior of the stock
relative to its Opening Price each day.
Here is how to interpret your forecast to better understand potential price trends.
The Four Pillars of the Daily Forecast
Each day in your 30-day view provides four specific data points. Think of these as the "blueprint" for that day's expected price action:
Open (The Anchor): This is the baseline. We use the opening price as the starting point because it represents the market's reset button for the day.
High (The Ceiling): The maximum level the stock is expected to reach. A rising "High" over several days suggests strong buyer momentum.
Low (The Floor): The minimum level the stock is expected to dip toward. A rising "Low" indicates that the stock is finding stronger support as time goes on.
Close (The Settlement): The final price of the day. This is the most critical value for determining if the overall trend for that day was positive or negative.
Understanding Our "Vector" Metric
To help you gauge the potential momentum of a stock, we use a specialized metric called the Vector. This value tells you in percentage terms how much the stock is expected to "drift" from its current price point.
What is the "Vector Value"?
Each day, a stock moves through a range of prices (Open, High, Low, and Close). Instead of looking at just the closing price, we calculate the Typical Average Price by averaging these four values: {Open + High + Low + Close} / 4
Think of this as the "center of gravity" for the day's trading. It smooths out the noise and gives us a single, representative value for the day's activity.
What the "Vector Value" Tells You
Once we have the Typical Price, we compare it to the next day forecasted open price (the reference price) to calculate the Percentage Deviation. This results in a single value that represents the expected momentum for the day:
A Positive Value (+): The model expects the stock's "center of gravity" to shift upward. This is a bullish signal, suggesting the stock is likely to trade higher than the reference price.
A Negative Value (-): The model expects the stock's "center of gravity" to shift downward. This is a bearish signal, suggesting the stock is likely to trade lower than the reference price.
A Value Near Zero: The model expects the stock to remain relatively stable, trading sideways with minimal directional bias.
How to Use the Vector Value
You can use this percentage to quickly rank or filter your stock list:
Filter for Opportunity: If you are looking for high-momentum stocks, look for those with the highest positive percentage values.
Identify Support & Resistance: A large deviation indicates that the model expects a significant move. A small deviation suggests the model expects the stock to remain within its current range.
Compare Across Assets: Because this value is expressed as a percentage, you can compare different stocks on an equal footing even if one is a $10 stock and the other is a $500 stock.
How to Evaluate Market Sentiment
You can quickly gauge the outlook for any day in your forecast by comparing the Close to the Open:
Bullish (Positive): If the Close is higher than the Open, the model expects buyers to control the day, resulting in a net price gain.
Bearish (Negative): If the Close is lower than the Open, the model expects selling pressure to outweigh buying activity.
Neutral/Consolidation: If the Close and Open are nearly identical, the model expects a day of indecision where the stock may trade sideways.
Gauging Volatility and Risk
The distance between the High and the Low (the "Range") tells you how volatile the model expects the day to be:
Wide Range: Indicates high expected volatility. There is greater potential for movement, but also higher uncertainty.
Narrow Range: Indicates low expected volatility. The model expects a calm, stable day with minimal price fluctuations.
Quality Assurance: Our "Clamping" Logic
You may notice that our forecast always maintains logical consistency for example, the High will never be lower than the Open, and the Low will never be higher than the Open.
We apply an internal "Clamping Layer" to ensure that all daily predictions respect the fundamental laws of market behavior. This prevents the model from generating "impossible" prices, giving you a cleaner and more realistic set of data for your decision-making.
Tips for Success
1. Look for Trends in the "Close": Rather than focusing on one day, look at the 30-day trend of the Close price to see if the overall trajectory is moving up, down, or sideways.
2. Monitor the "Support" Levels: Watch the Low values. If the predicted Low begins to rise over several days, it often signals that the stock is finding a new level of support, which can be a bullish indicator.
3. Combine with Context: While our model identifies patterns based on historical data, it cannot predict sudden, unexpected news events (like earnings reports or global economic shifts). Use these forecasts as a statistical "map" to assist your analysis, but always pair them with your own research.
Understanding Our New Trade Signal Logic
We have upgraded our trading signal engine to provide you with more reliable and disciplined market insights. Instead of simply reacting to price changes, our new system acts like an experienced analyst evaluating the "why" behind every move before suggesting a trade.
Our signals are now driven by three core market metrics: Intraday Bias, Trend Momentum, and Volume Conviction.
The Three Pillars of Our Trading Signals
Every day, the system evaluates the stock based on these three specific conditions. Think of price as the direction the car is facing, and volume as the gas in the tank.
Intraday Bias (The Anchor): This measures the stock's behavior relative to its Opening Price. By comparing the Open to the Close, we see who "won" the day:
Positive: The stock finished stronger than it started (Bullish).
Negative: The stock finished weaker than it started (Bearish).
Trend Momentum (The Context): This measures the broader direction by comparing today's closing price to yesterday's closing price. It tells us if the stock is continuing its established path.
Volume Conviction (The Lie Detector): This measures the strength of the market's conviction behind a price move by comparing forecasted volume to the rolling 20-day average.
High Conviction (RVOL >= 1.5): Strong institutional participation. The price move is likely driven by significant capital, suggesting high reliability.
Normal Conviction (0.8<= RVOL <= 1.5): Healthy market participation. The price move is consistent with standard trading patterns.
Low Conviction (RVOL < 0.8): Weak participation. The price move may lack the "energy" to be sustainable, often signaling that a reversal or stagnation is more likely.
How to Interpret Our Trading Signals
By combining these three metrics, the system creates a highly disciplined filter that weeds out market noise. It helps you avoid low-volume "fake-outs" and focus only on high-conviction moves.
Here is how the system determines Forecastica BUY, SELL and HOLD trading signals:
| Bias |
Momentum |
Volume |
Macro Trend |
Signal |
What It Means |
| Positive |
Positive |
High |
Bullish |
BUY |
Strong trend alignment with high institutional conviction. |
| Positive |
Positive |
High |
Any |
BUY |
High volume momentum overriding macro uncertainty. |
| Any |
Positive |
Any |
Bullish |
BUY |
Macro alignment: Upward momentum secured by a bullish backdrop. |
| Negative |
Negative |
High |
Bearish |
SELL |
Heavy selling pressure; full downward trend alignment. |
| Negative |
Negative |
High |
Any |
SELL |
Intense sell-off overriding any mixed macro backdrop. |
| Negative |
Negative |
Normal |
Any |
SELL |
Consistent selling trend with standard market participation. |
| Any |
Negative |
Any |
Bearish |
SELL |
Downward momentum confirmed by a larger macro downtrend. |
| Positive |
Positive |
Normal |
Neutral |
BUY |
Steady upward trend growth in a neutral macro environment. |
| Positive |
Negative |
Low |
Bullish |
BUY |
Smart Pullback: Buying a low-volume dip inside a broader bull trend. |
| Negative |
Positive |
Low |
Bearish |
SELL |
Bear Flag: Selling a weak, low-volume rally in a macro downtrend. |
| Positive |
Positive |
Low |
Bearish |
SELL |
Weak Momentum: Upward crawl failing against macro bear trend. |
| Negative |
Positive |
High |
Bearish |
SELL |
Bull Trap: Price attempts to rally, but sellers aggressively override. |
| Neutral |
Negative |
Any |
Any |
SELL |
Exhaustion: Lack of intraday buying power failing against downward momentum. |
| Positive |
Negative |
High |
Bearish |
HOLD |
High-Risk Trap: Intraday bounce clashing with high sell volume and bear macro. |
| Positive |
Negative |
High |
Any |
HOLD |
Clashing Signals: Intraday buyers fighting heavy selling volume. |
| Positive |
Negative |
High |
Neutral |
HOLD |
Volatile Chop: Heavy selling pressure neutralizing intraday positivity. |
| Negative |
Negative |
Low |
Bullish |
HOLD |
Weak Pullback: Awaiting support confirmation in a macro bull market. |
| Negative |
Positive |
High |
Bullish |
HOLD |
High volume dip buying attempt; wait for clear reversal. |
| Neutral |
Positive |
High |
Bullish |
HOLD |
Sideways intraday action despite strong underlying momentum. |
| Neutral |
Negative |
High |
Bearish |
HOLD |
Indecision holding up heavy momentum in a bear trend. |
| Positive |
Positive |
High |
Bearish |
HOLD |
Counter-trend Risk: Short-term bullish pump, but macro trend is hostile. |
| Positive |
Positive |
Normal |
Bearish |
HOLD |
Moderate counter-trend move; unsafe to allocate capital. |
| Negative |
Positive |
High |
Any |
HOLD |
High volume bounce from negative start; volatile setup. |
| Negative |
Positive |
Normal |
Any |
HOLD |
Market noise; indicators currently in conflict. |
| Positive |
Negative |
Normal |
Any |
HOLD |
Lower conviction sell signal; maintain current position. |
| Negative |
Negative |
Normal |
Bullish |
HOLD |
Moderate selling within a macro bull market; await direction. |
| Any |
Any |
Low |
Any |
HOLD |
Market Chop: Low participation environments are unsafe. |
| Neutral |
Any |
Any |
Any |
HOLD |
Intraday indecision; await clear market direction. |
| Any |
Neutral |
Any |
Any |
HOLD |
Momentum is flat; consolidation phase underway. |
| Any |
Any |
Any |
Any |
HOLD |
Safety hold for mixed or unspecified conditions. |
| Any |
Positive |
Low |
Bullish |
HOLD |
Weak upward momentum in a bull trend; lacking conviction. |
| Any |
Negative |
Low |
Bearish |
HOLD |
Weak downward momentum in a bear trend; lacking conviction. |
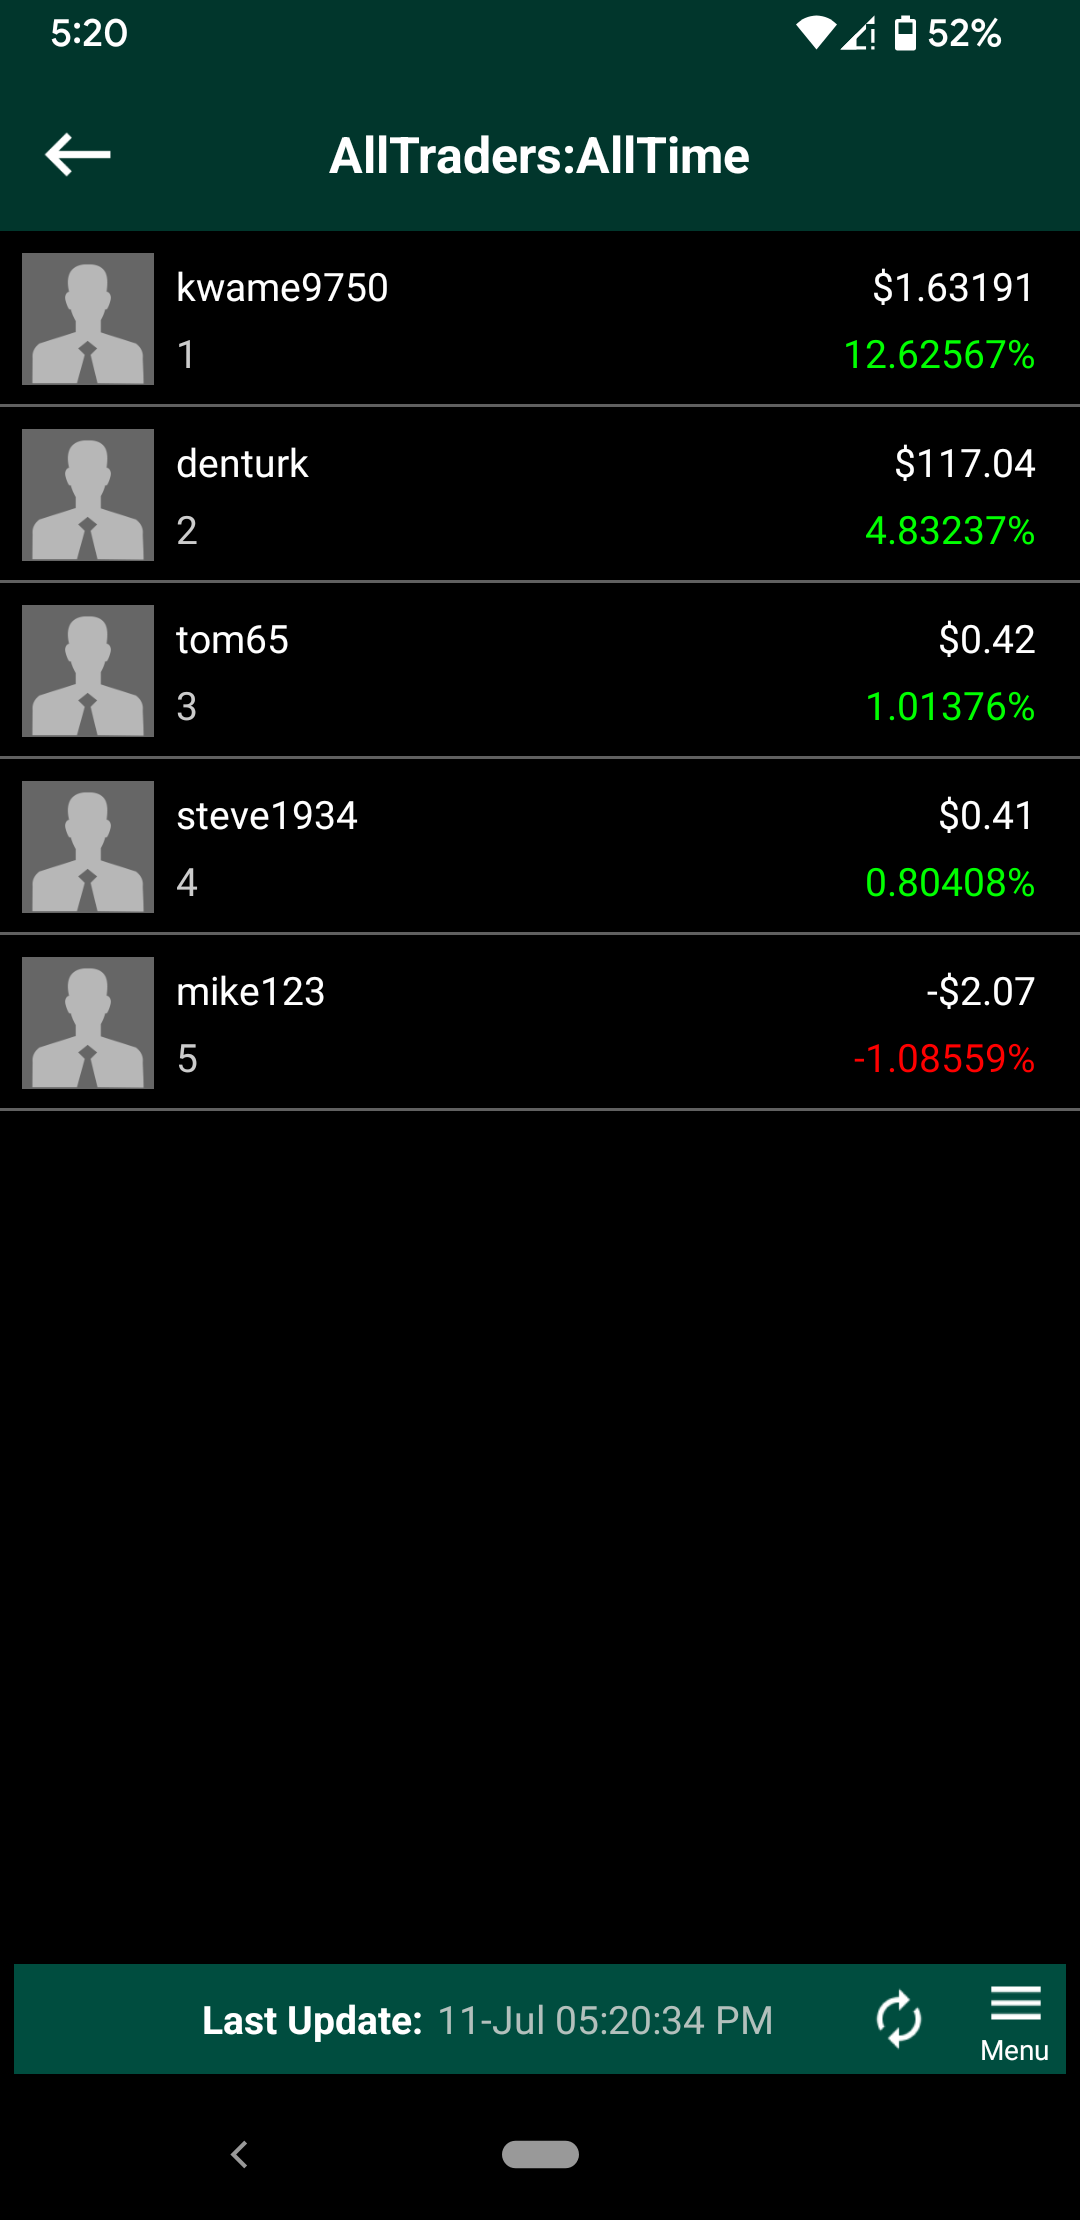
Forecastica is the most advanced virutal trading platform in the world. You can also view other traders portfolios, stocks and trades.
Traders are ranked based on their Sharp Ratio. The Sharpe Ratio is a well-known and well-reputed measure of risk-adjusted return on an investment or portfolio.
It was developed by the economist William Sharpe. The Sharpe Ratio evaluates the total performance of an aggregate traders investment portfolios.
If a trader only has one trade their Sharp Ratio will be zero because more than one trade is necessary to calculate the Sharp Ratio.
|
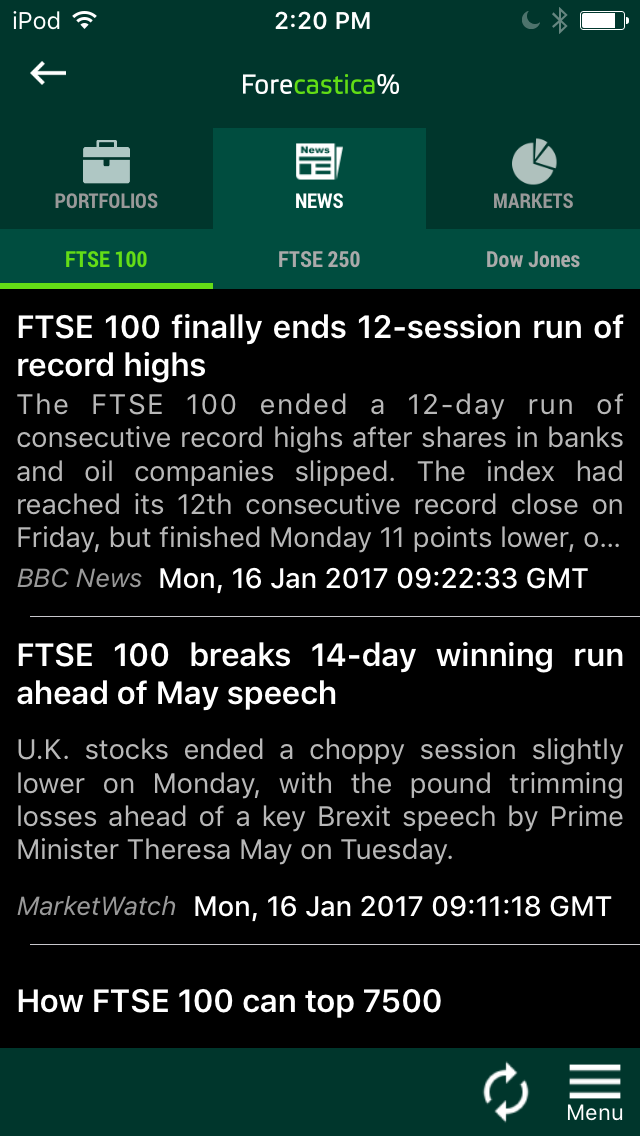
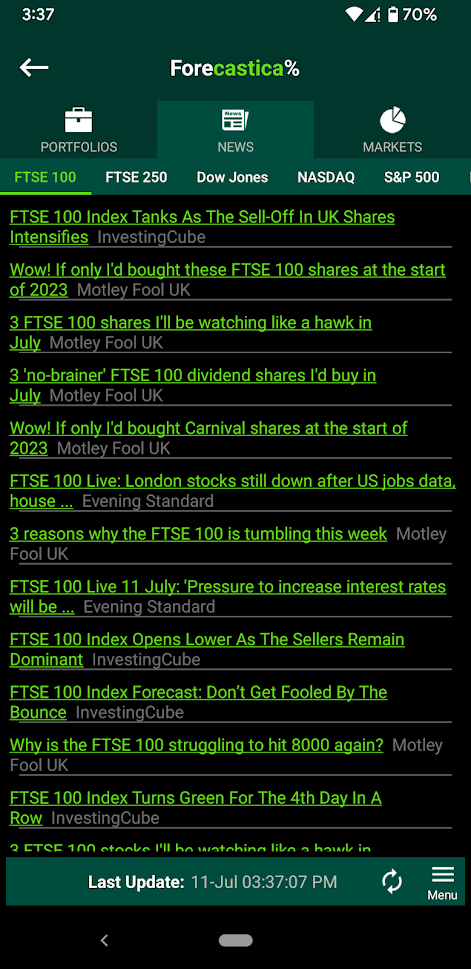
Track stock index news across the most well known indexes in the world which include FTSE 100, FTSE 250, Dow Jones, NASDAQ, S&P 500, Hnag Seng, Nikkei 225, German Dax, Belgium 20 and Netherlands FTI.
|
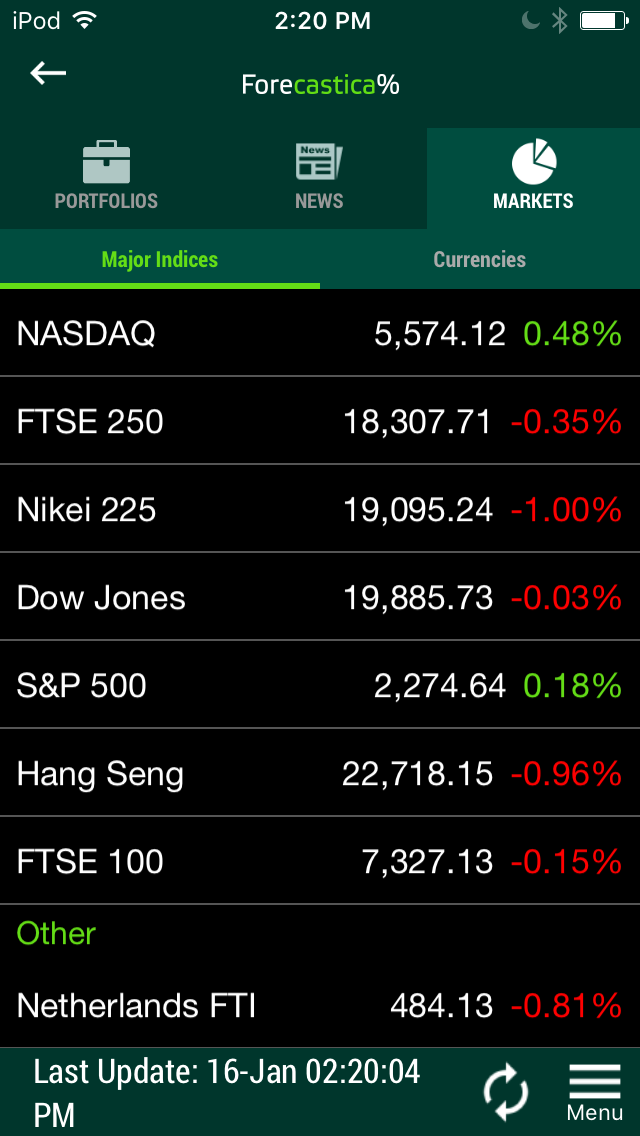
Track Stock Indexes
|
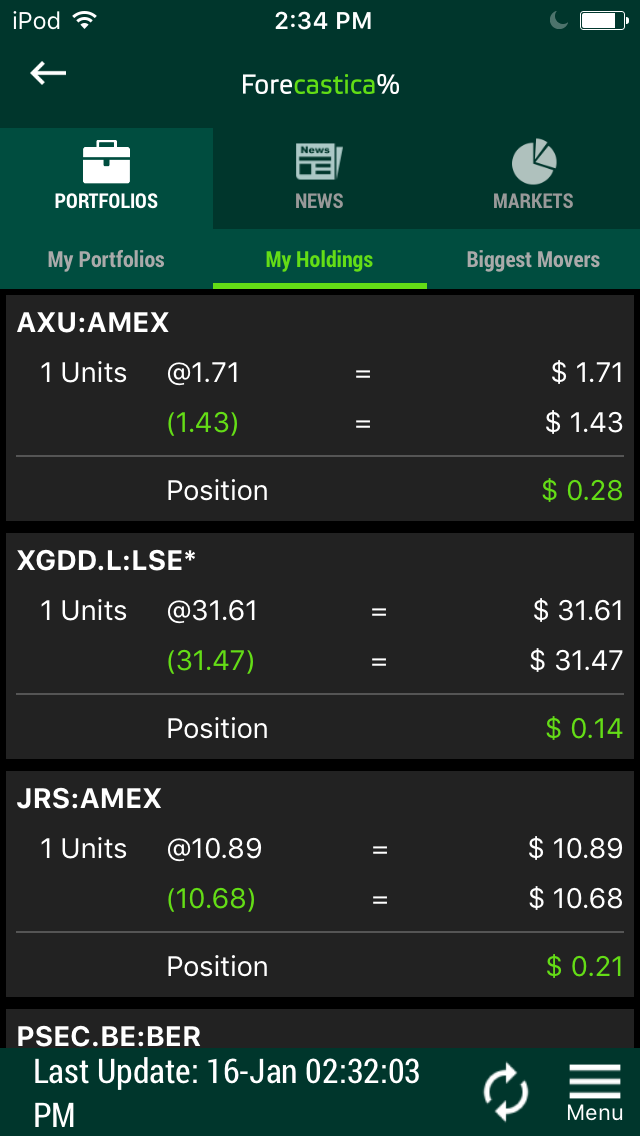
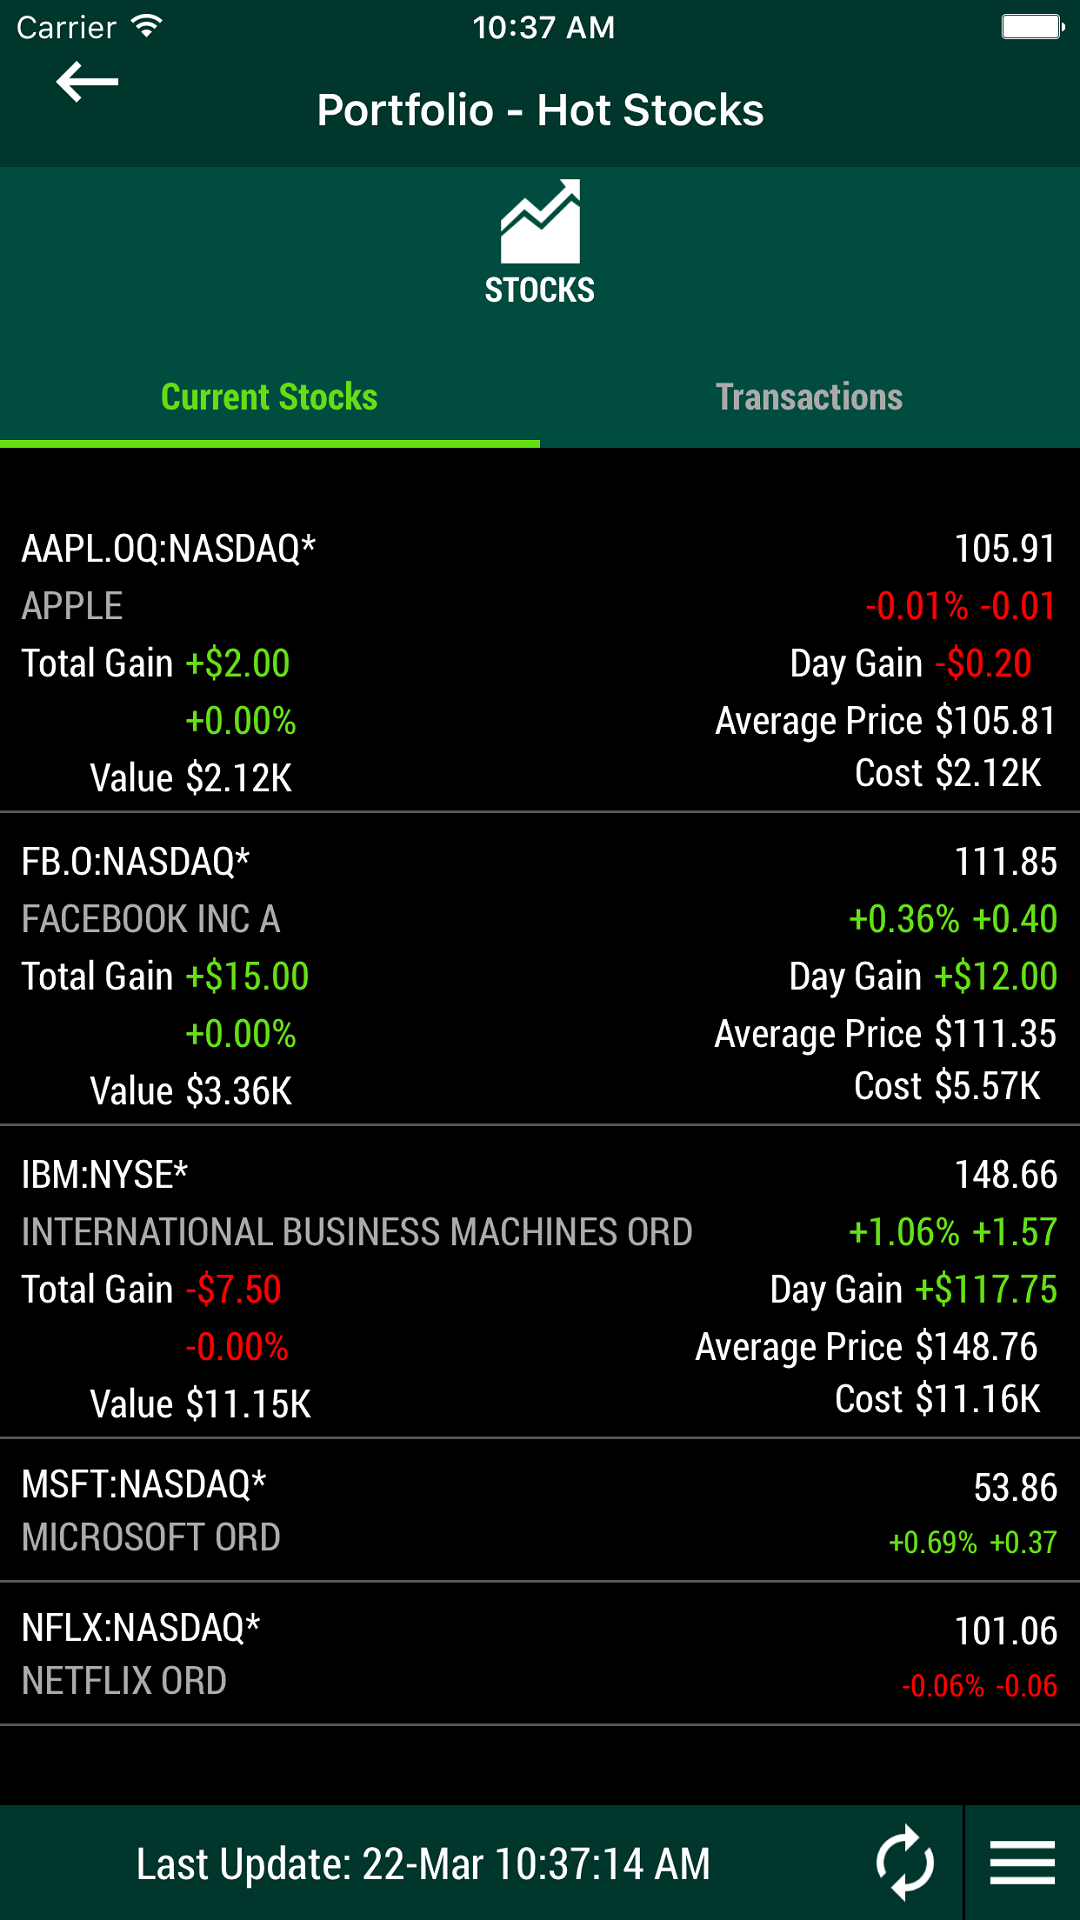
View your stock holdings as you make stock trades across 200,000 stocks spanning 90 of the most well known exchanges in the world!
|
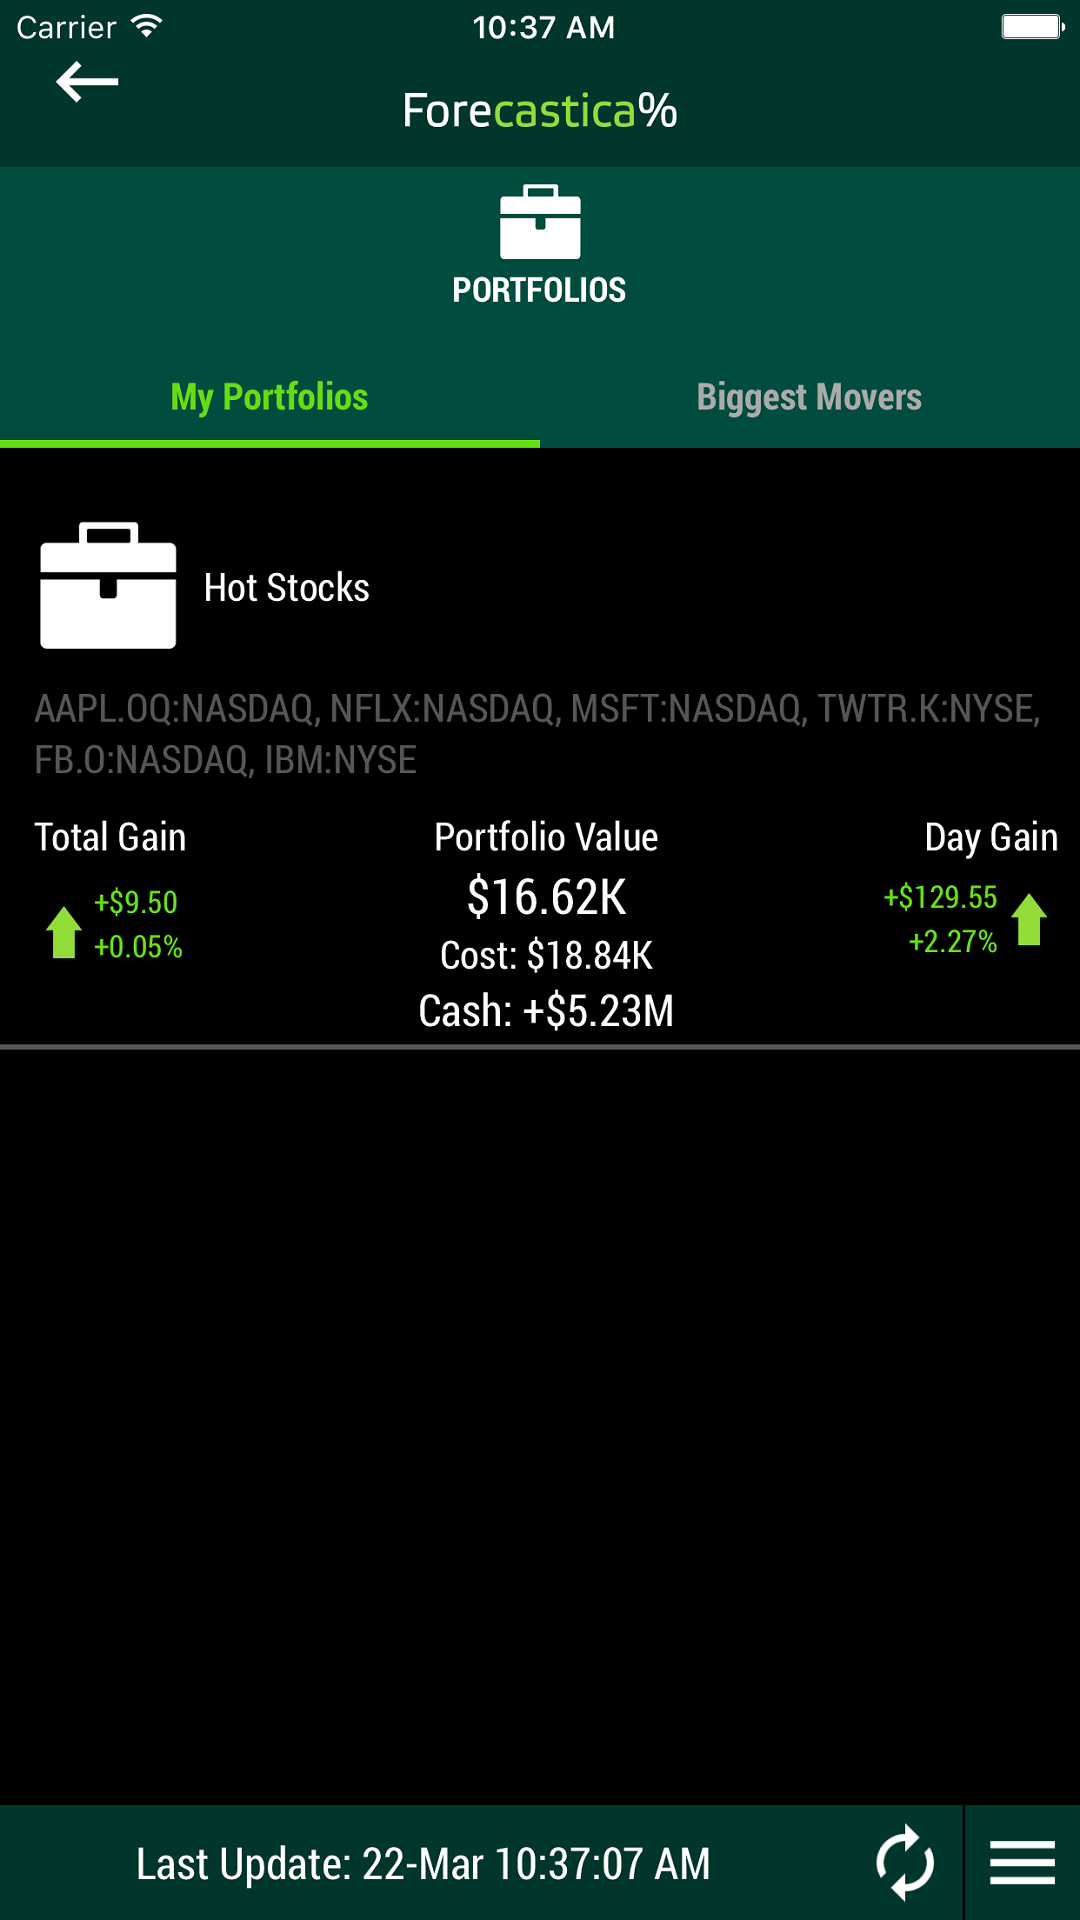
Create multiple portfolios to track your holdings and trades while analyzing total loss/gain.
|
View stocks in your portfolio and track total loss/gain
|
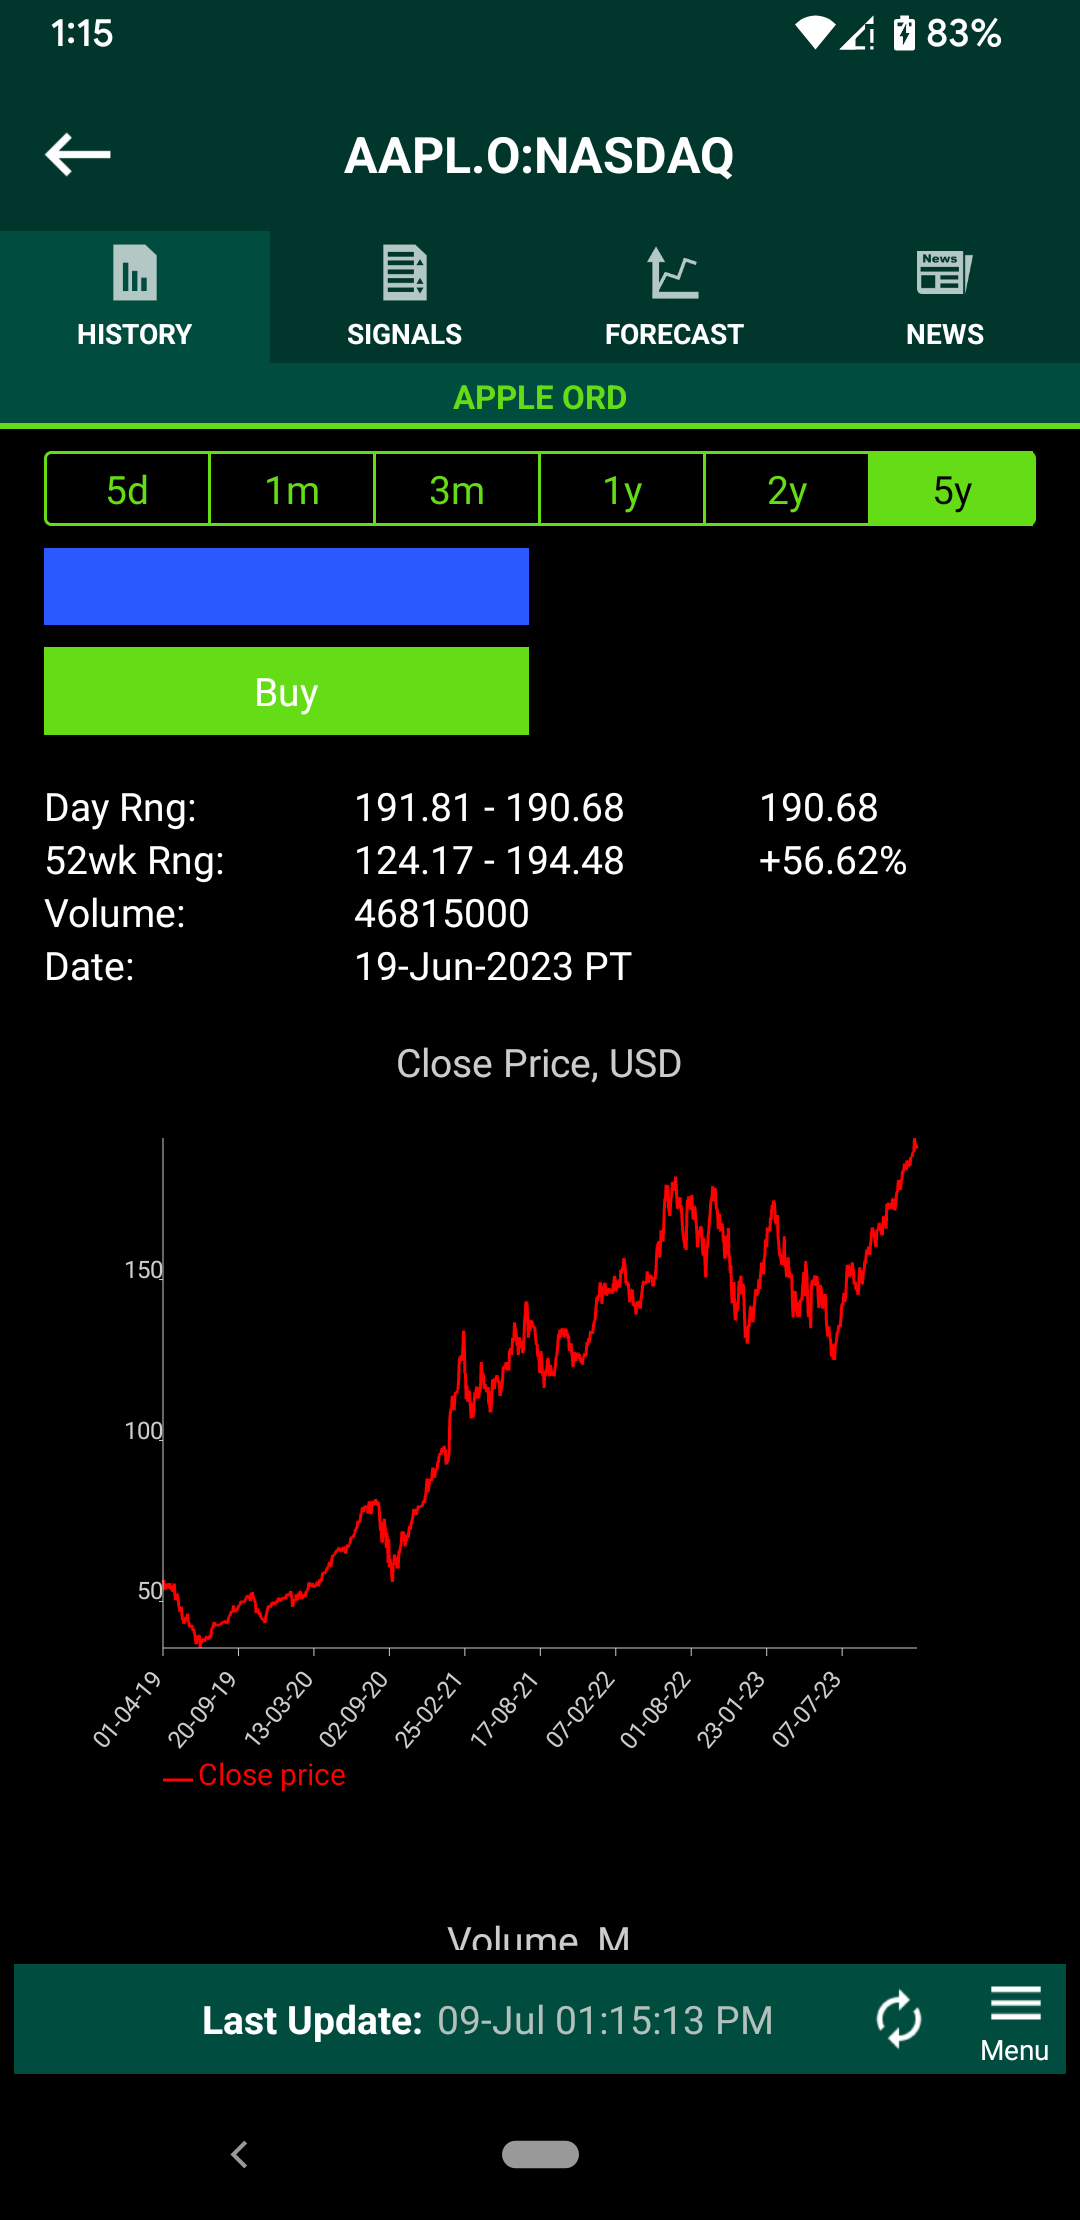
Advanced History Chart with end of day close price, volume with tons of indicators filter by 5 days, 1 month, 3 month, 1 year, 2 year, 3 years and 5 years
|
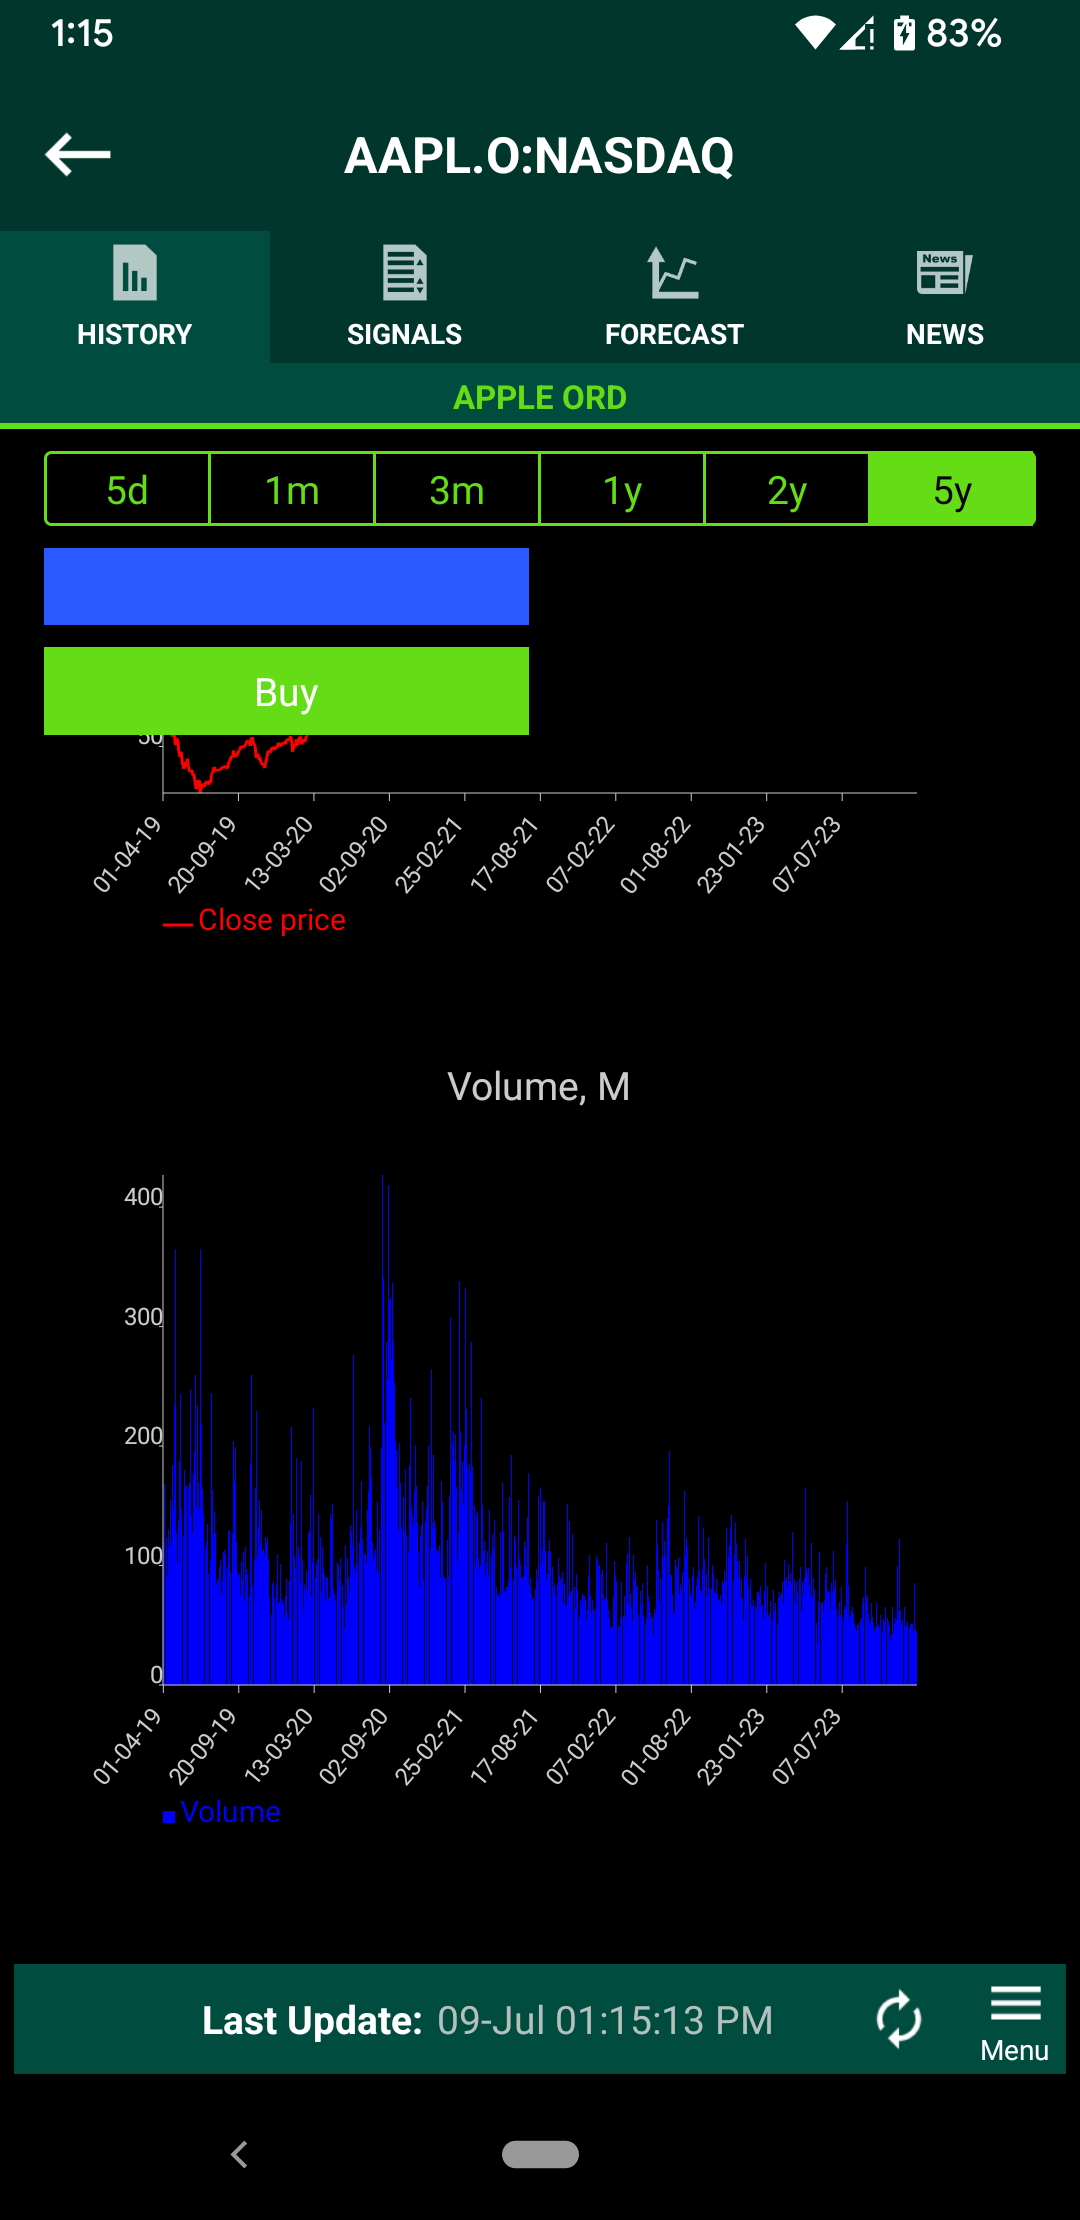
Advanced History Chart with end of day close price, volume with tons of indicators filter by 5 days, 1 month, 3 month, 1 year, 2 year, 3 years and 5 years
|
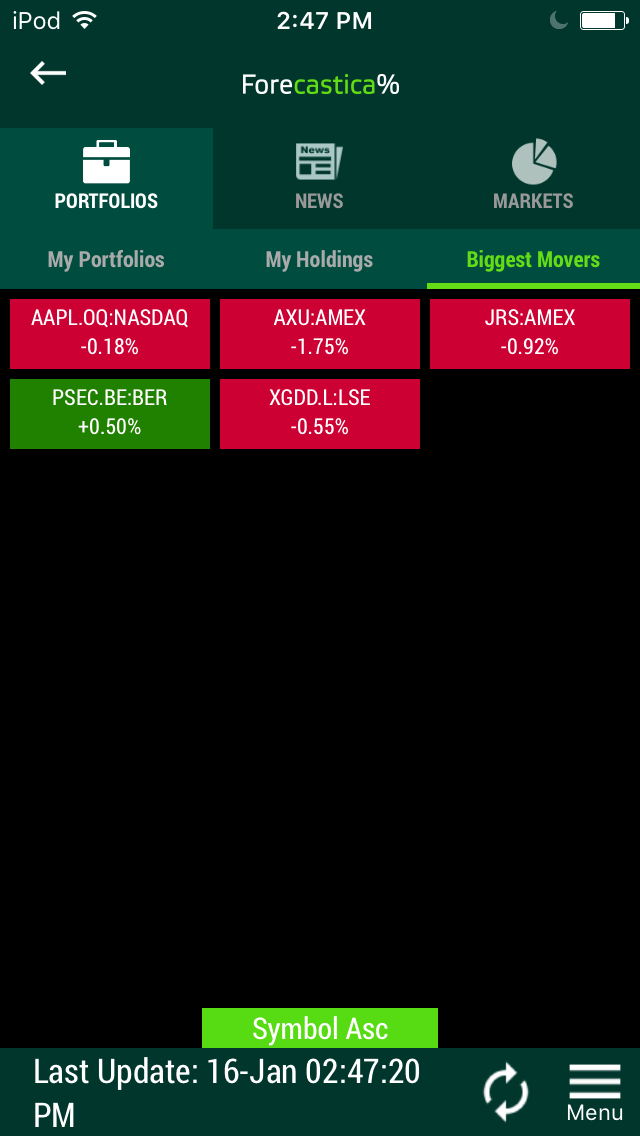
Biggest Movers color coded tiles show daily stock price movement for all companies across your portfolio.
|
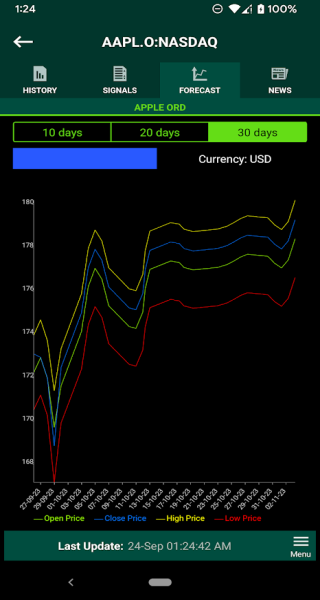
10, 20 and 30 day AI/ML powered stock forecast along with AI/ML powered BUY, SELL, HOLD recommendations. Vector shows expected forecasted price movement as a percentage.
|
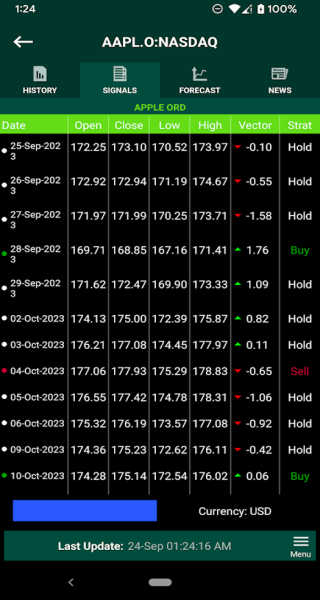
Check out the 30-day stock forecasting table with BUY, SELL and HOLD recommendations based on our proprietary AI/ML model that is based on machine learning and neural networks
|
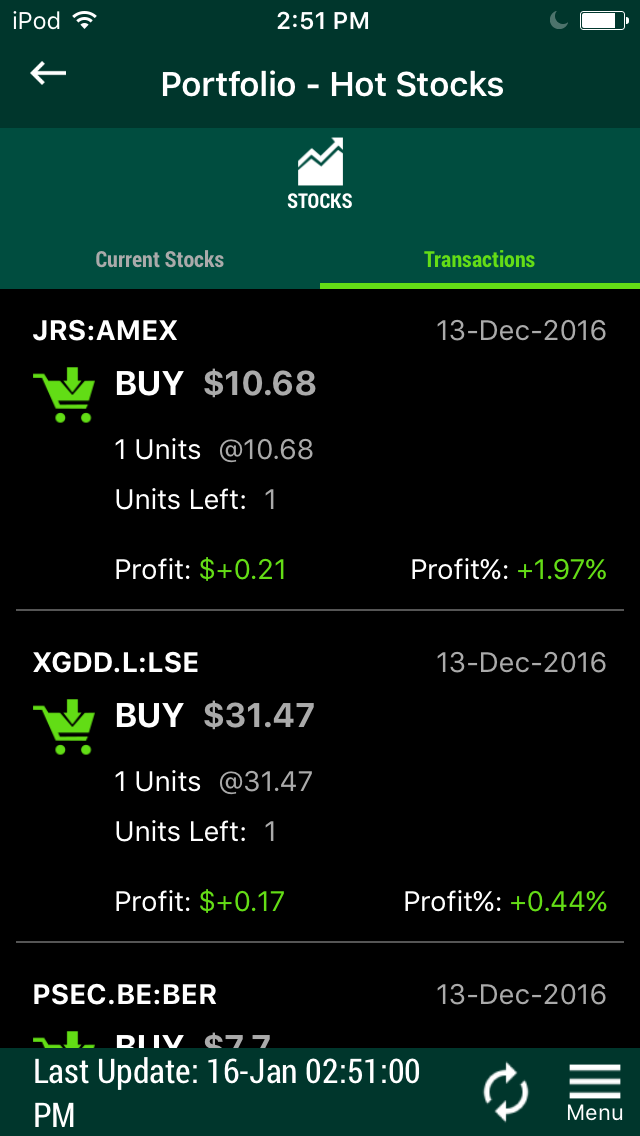
Buy, sell stocks and track transaction profit loss/gain
|

Create multiple portfolios to track your favorite stocks
|
Track stock index news
|
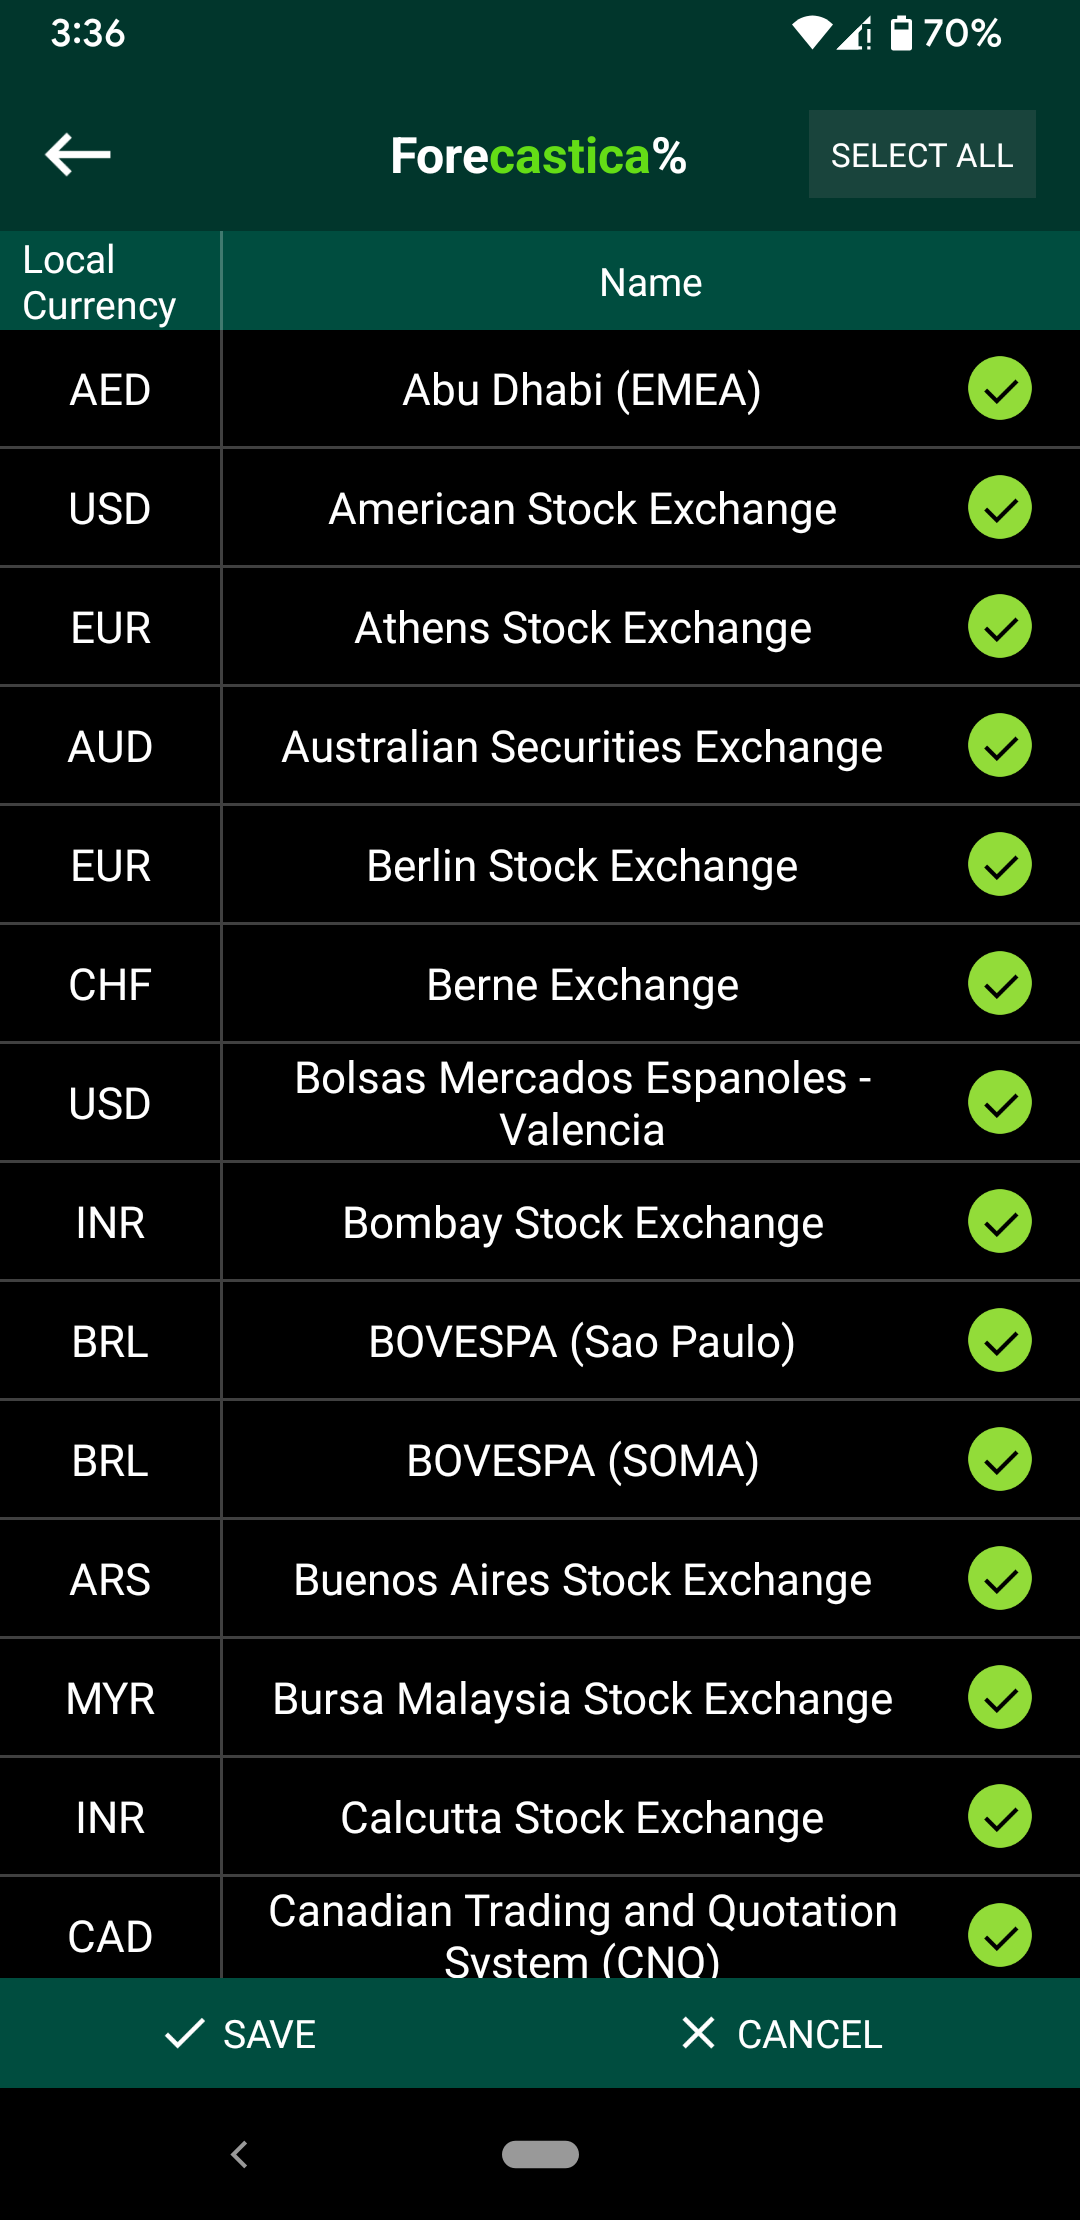
Track stock forecasts for roughly 200,000 stocks spanning 90 of the most well known stock exchanges in the world!
|
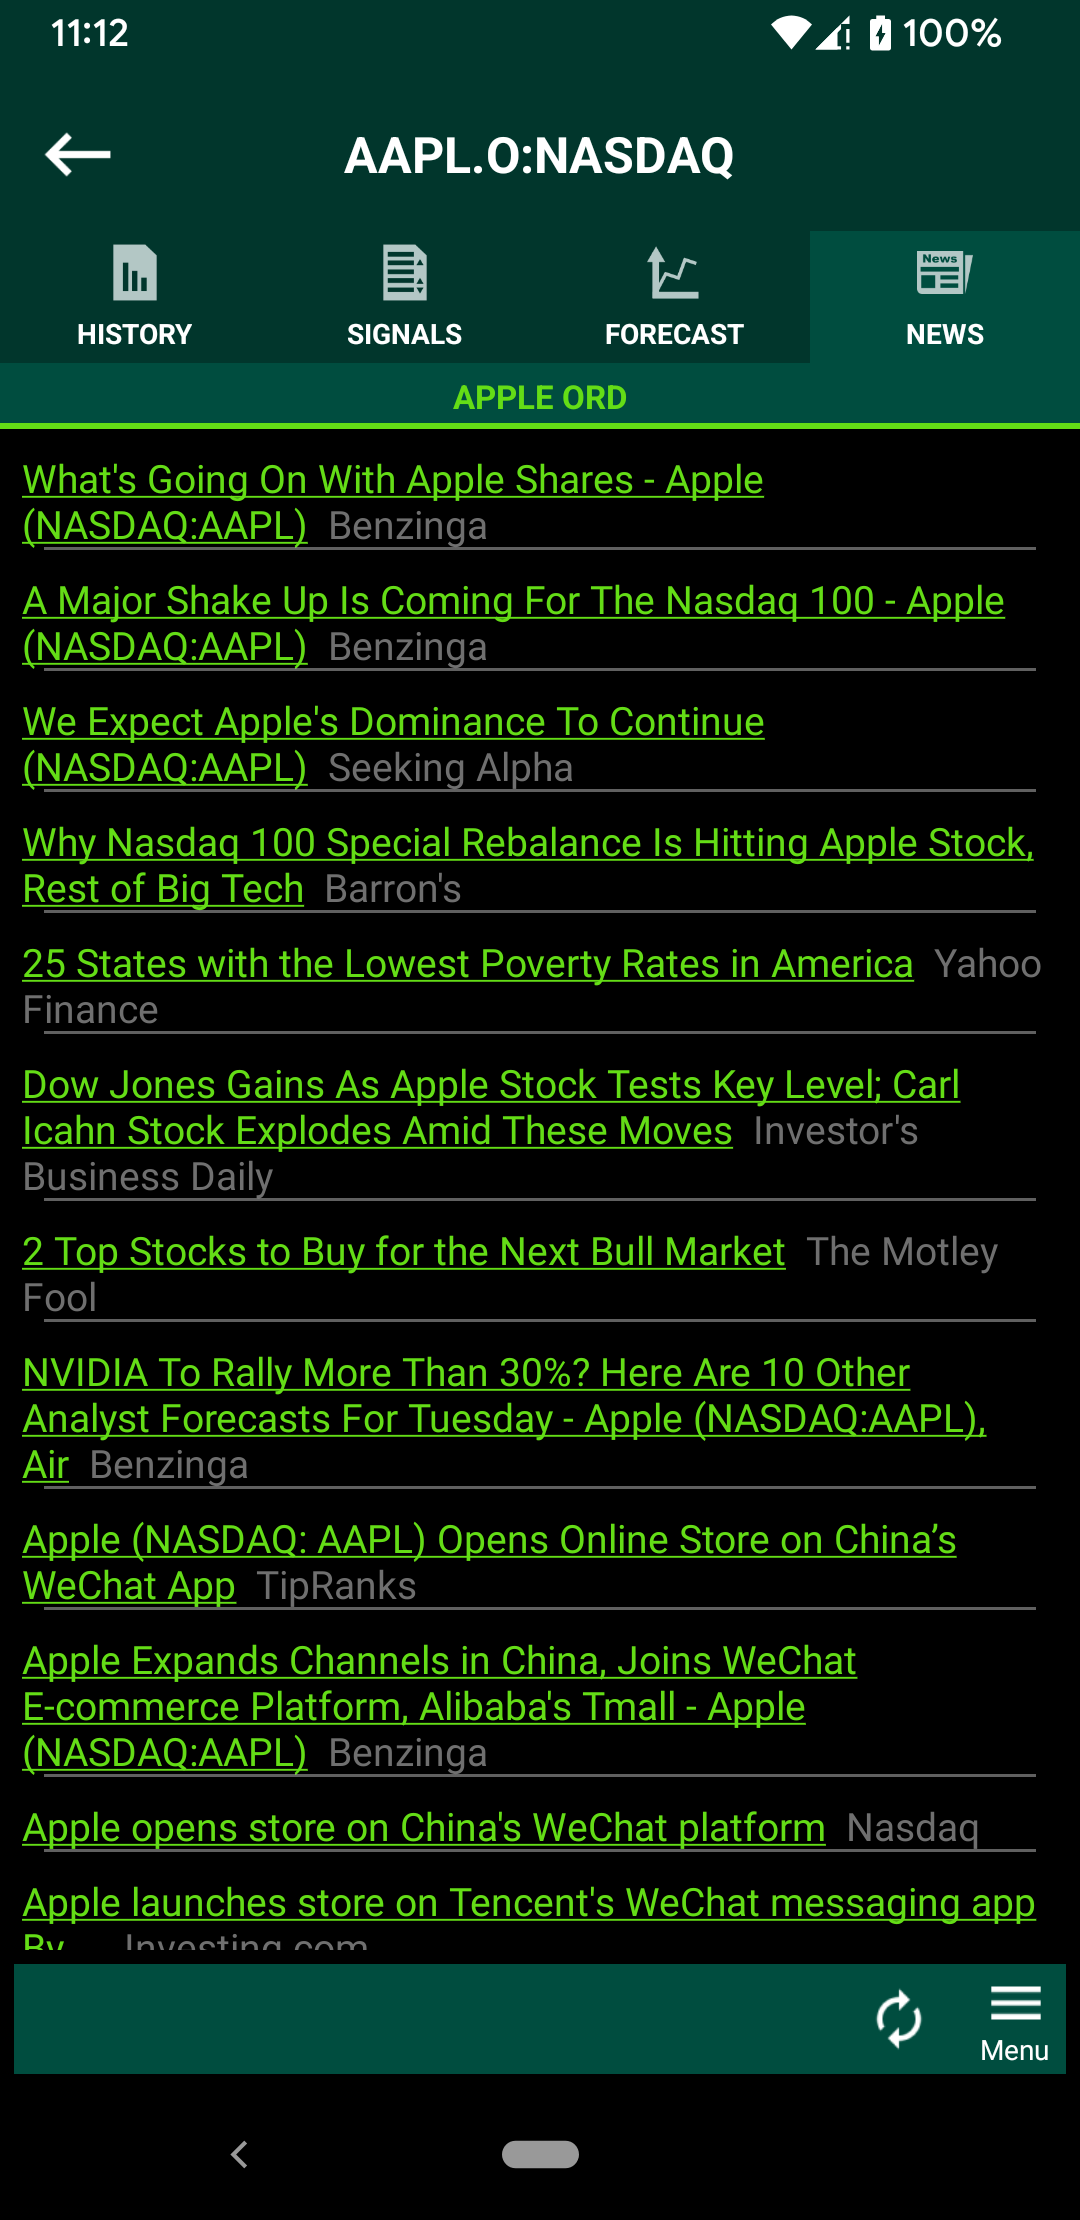
Track stock news for roughly 200,000 stocks spanning 90 of the most well known exchanges in the world!
|